
Why Depreciation Is the Hidden Cost Most Drivers Underestimate
When people calculate the cost of owning a car, they typically focus on the monthly payment, insurance, and fuel. Depreciation - the loss in the vehicle's market value - rarely appears on anyone's monthly budget, yet it is often the single largest expense per mile driven.
For a new vehicle purchased at $35,000 that loses 20% of its value in year one, that's $7,000 in lost wealth - regardless of how carefully the car was driven. Unlike a loan payment, this loss doesn't appear on a bank statement, which makes it easy to overlook. Understanding how depreciation works is a foundational skill for any car owner making smart financial decisions. See the full picture of annual vehicle costs for a broader breakdown of what ownership really runs you each year.
~20%
Average first-year value loss for new vehicles
Industry valuation analysts generally estimate that new cars lose between 15% and 25% of their value in the first year, with the average clustering near 20%.
~50%
Typical value remaining after five years
Many mainstream passenger vehicles retain roughly 40-60% of their original value at the five-year mark, depending on segment, condition, and market demand.
Year 1-3
Steepest depreciation window for most cars
The first three years of ownership account for a disproportionate share of a vehicle's total lifetime depreciation, making early ownership the most expensive period on a value-loss basis.
How the Depreciation Curve Actually Works
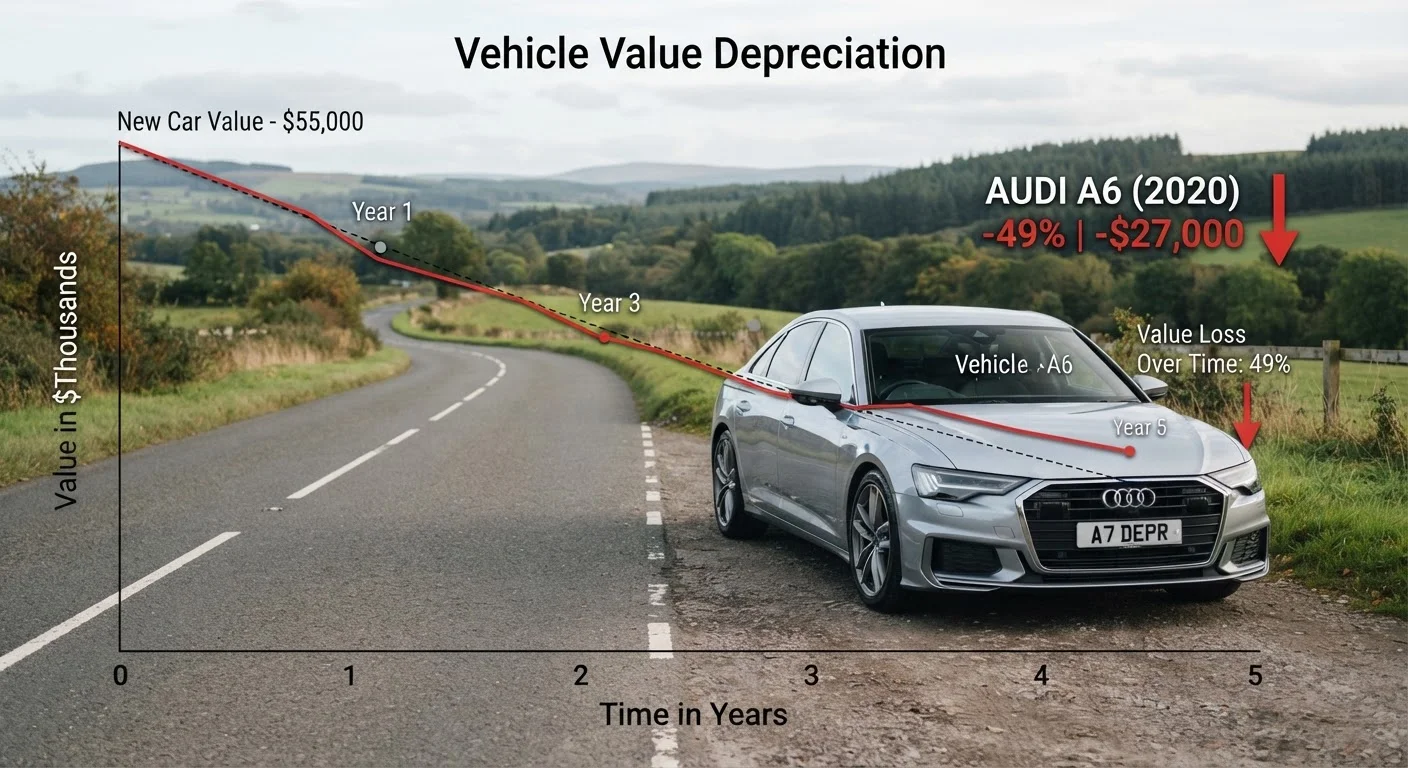
Depreciation does not happen at a flat, predictable rate. Instead, it follows a curve that is steepest at the start of ownership and gradually flattens as the vehicle ages. Here's a general pattern many passenger vehicles follow:
- Year 1: Loss of roughly 15-25% of original value
- Years 2-3: Additional 10-15% per year
- Years 4-5: Losses moderate to around 5-10% annually
- Year 5+: Depreciation slows significantly as the vehicle approaches a more stable used-car floor
These figures are general estimates. The actual curve varies considerably by vehicle segment, brand perception, fuel type, and prevailing market conditions. Electric vehicles, for example, have shown more volatile depreciation patterns as the market for used EVs continues to mature.
Depreciation Estimates Are Generalizations
Published depreciation figures represent averages across large vehicle populations. Your specific car's value will depend on local market conditions, its actual condition and mileage, and the timing of your sale. Use multiple valuation sources - such as independent vehicle pricing guides - to get a realistic estimate for your situation.
This is the core insight behind the financial appeal of buying a lightly used vehicle - a two- or three-year-old car has already absorbed the steepest part of the curve. For a deeper look at that trade-off, see new car vs. used car considerations.
What Drives the Rate of Depreciation
Not all vehicles depreciate at the same pace. Several variables push a car's resale value up or down relative to average:
- Mileage
- Higher annual mileage signals more wear and reduces perceived remaining useful life. Vehicles with significantly above-average miles typically fetch less at resale.
- Condition and service history
- A well-maintained vehicle with documented service records commands a premium in the private market and at trade-in. Evidence of care directly offsets depreciation pressure.
- Market demand
- Trucks and SUVs have historically held value better than sedans in the U.S. market, largely because of sustained consumer demand. Supply shocks - such as those seen during recent new-car inventory shortages - can temporarily slow or even reverse depreciation for certain segments.
- Brand reliability reputation
- Vehicles from manufacturers with strong long-term reliability track records tend to depreciate more slowly because buyers are willing to pay more for a used example.
- Fuel type and technology
- As technology evolves, older powertrains can lose appeal faster. This has been a particular dynamic in the early EV and hybrid markets.
Depreciation and Your Ownership Decisions
Once you understand the shape of the depreciation curve, it can inform several practical decisions:
Buying vs. leasing: Lease payments are partially structured around estimated depreciation over the lease term. If a vehicle depreciates slowly, lease payments tend to be lower because the residual value (what the car is worth at lease end) is higher. Understanding this mechanism helps you evaluate lease deals more critically. Learn how mileage habits affect the buying vs. leasing decision.
Insurance and total-loss claims: Standard auto insurance policies typically pay actual cash value - your vehicle's depreciated market worth - in a total-loss event. This can leave a gap between the settlement and an outstanding loan balance. Understanding this connection matters for coverage decisions. See how actual cash value vs. replacement cost affects claim payouts.
Trade-in timing: Trading in or selling a vehicle after the steepest depreciation has occurred - typically past the three-year mark - means you retain a larger share of remaining value per additional year of use. This is a general principle, not a guarantee; individual market conditions always apply.
Preserve Resale Value With Simple Habits
Keeping up with scheduled maintenance, storing service records, addressing minor cosmetic damage promptly, and avoiding excessive annual mileage are among the most effective ways to maximize a vehicle's resale value. None of these habits eliminate depreciation, but they help your car land at the higher end of its value range when it comes time to sell or trade in.
This article provides general financial and automotive information for educational purposes and does not constitute personalized financial or purchasing advice. Consult a qualified financial professional for guidance specific to your situation.